Think of your business like a finely tuned race car. To win, the driver can't just focus on the finish line; they need to keep a close eye on the dashboard—speed, fuel, tire pressure, engine temp. Those real-time gauges are exactly what Operational Performance Indicators (OPIs) are for your business. They give you a live look at how efficiently everything is running day-to-day.
The Dashboard That Drives Your Business
Many business leaders get caught up in the big, long-term goals, which are obviously important. But operational performance indicators zoom in on what’s happening right now. They aren't about next year's market share; they're about the health and speed of your core processes today—the very things that make customers happy and bring in revenue.
These metrics are the pulse of your daily work. They answer the nitty-gritty questions that actually determine your success:
- How fast are we getting orders out the door?
- What’s our success rate for fixing a customer's issue on the first call?
- How much waste did we produce on the line this morning?
When you track these details, you stop guessing where the problems are. Instead, you get clear, data-driven signals telling you exactly where to step in and make a change.
OPIs vs. KPIs A Simple Distinction
People often throw these terms around as if they're the same thing, but they serve different purposes. If you need a refresher, here's a comprehensive definition of Key Performance Indicators (KPIs), which tend to measure progress toward big, strategic goals.
OPIs, on the other hand, are all about the short-term, granular details. For instance, a big-picture KPI might be to "Increase annual customer retention by 10%." That's a great goal, but how do you get there? You get there by improving the OPIs your team can actually control, like "Average Customer Wait Time" or "First Contact Resolution Rate."
The Simple Truth: KPIs are the compass pointing your ship to its destination. OPIs are the gauges in the engine room that help you fine-tune the machinery to get you there smoothly and efficiently. You absolutely need both.
Why This Matters for Your Bottom Line
When you start tracking operational performance, you'll see a direct link to your profitability. It's not just theory. A manufacturing plant that monitors an OPI like "Machine Downtime" can spot failing equipment and schedule maintenance before it breaks down. This simple act prevents a production halt that could easily cost thousands of dollars per hour.
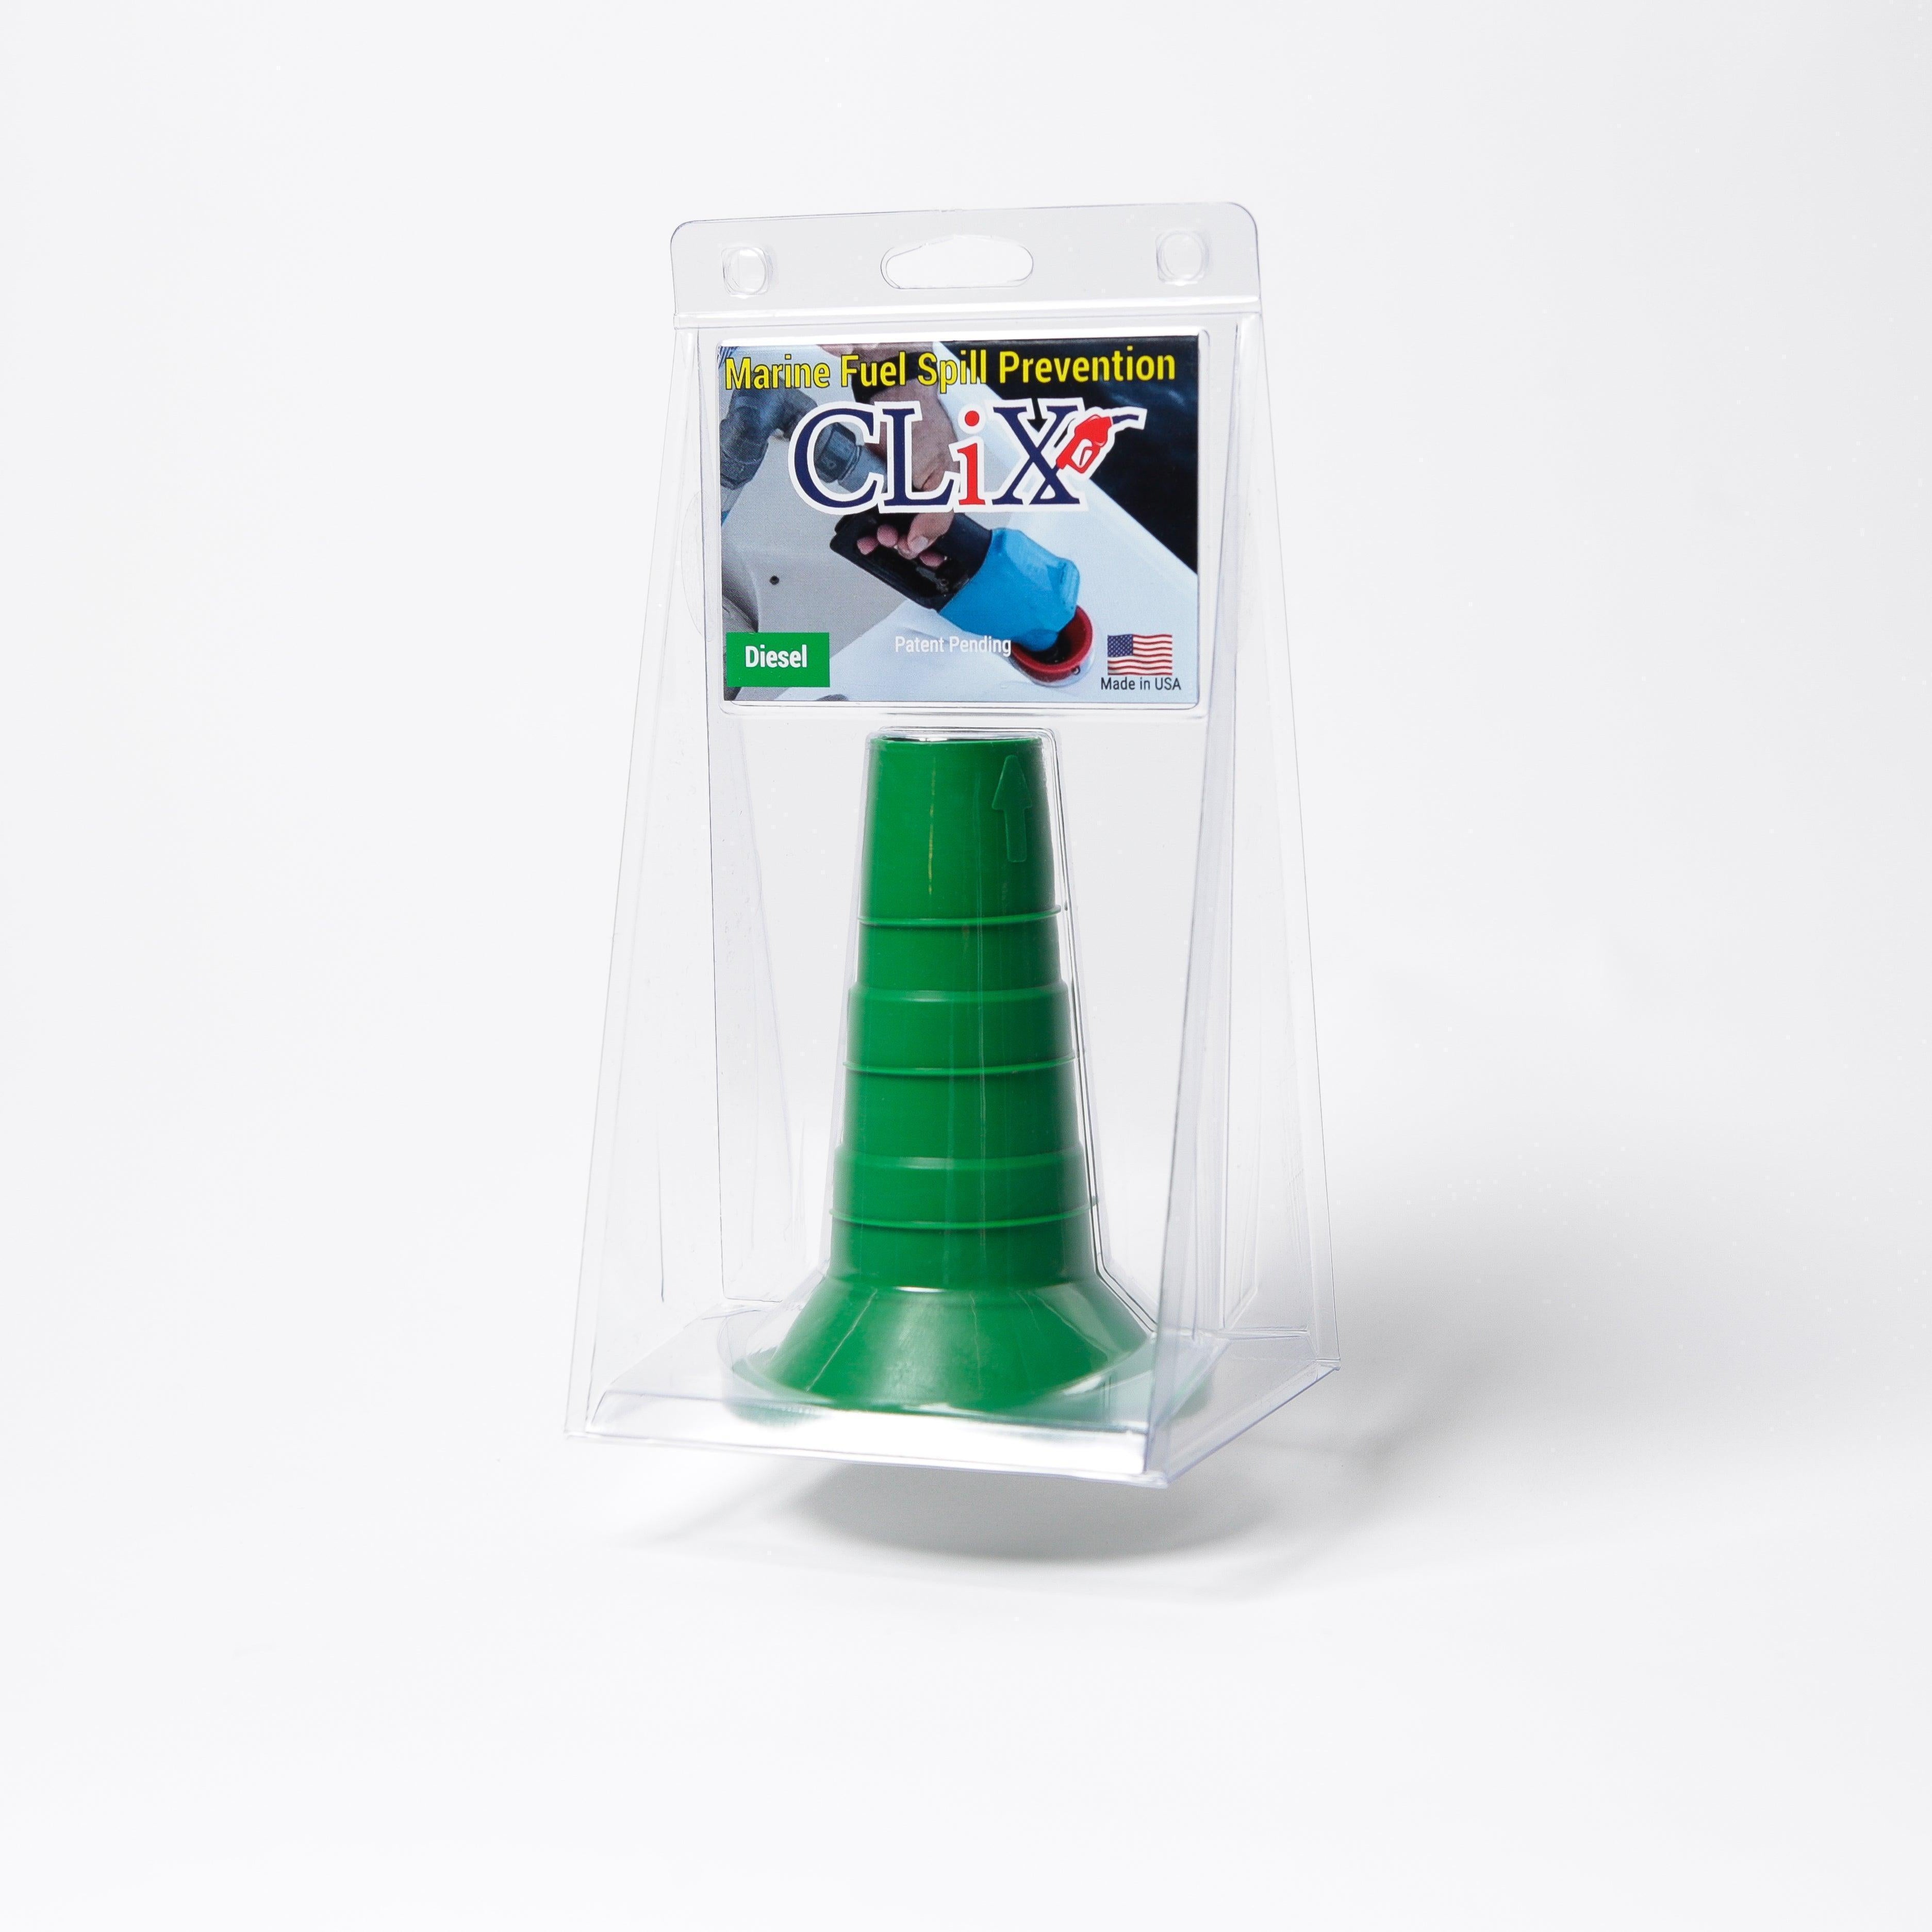
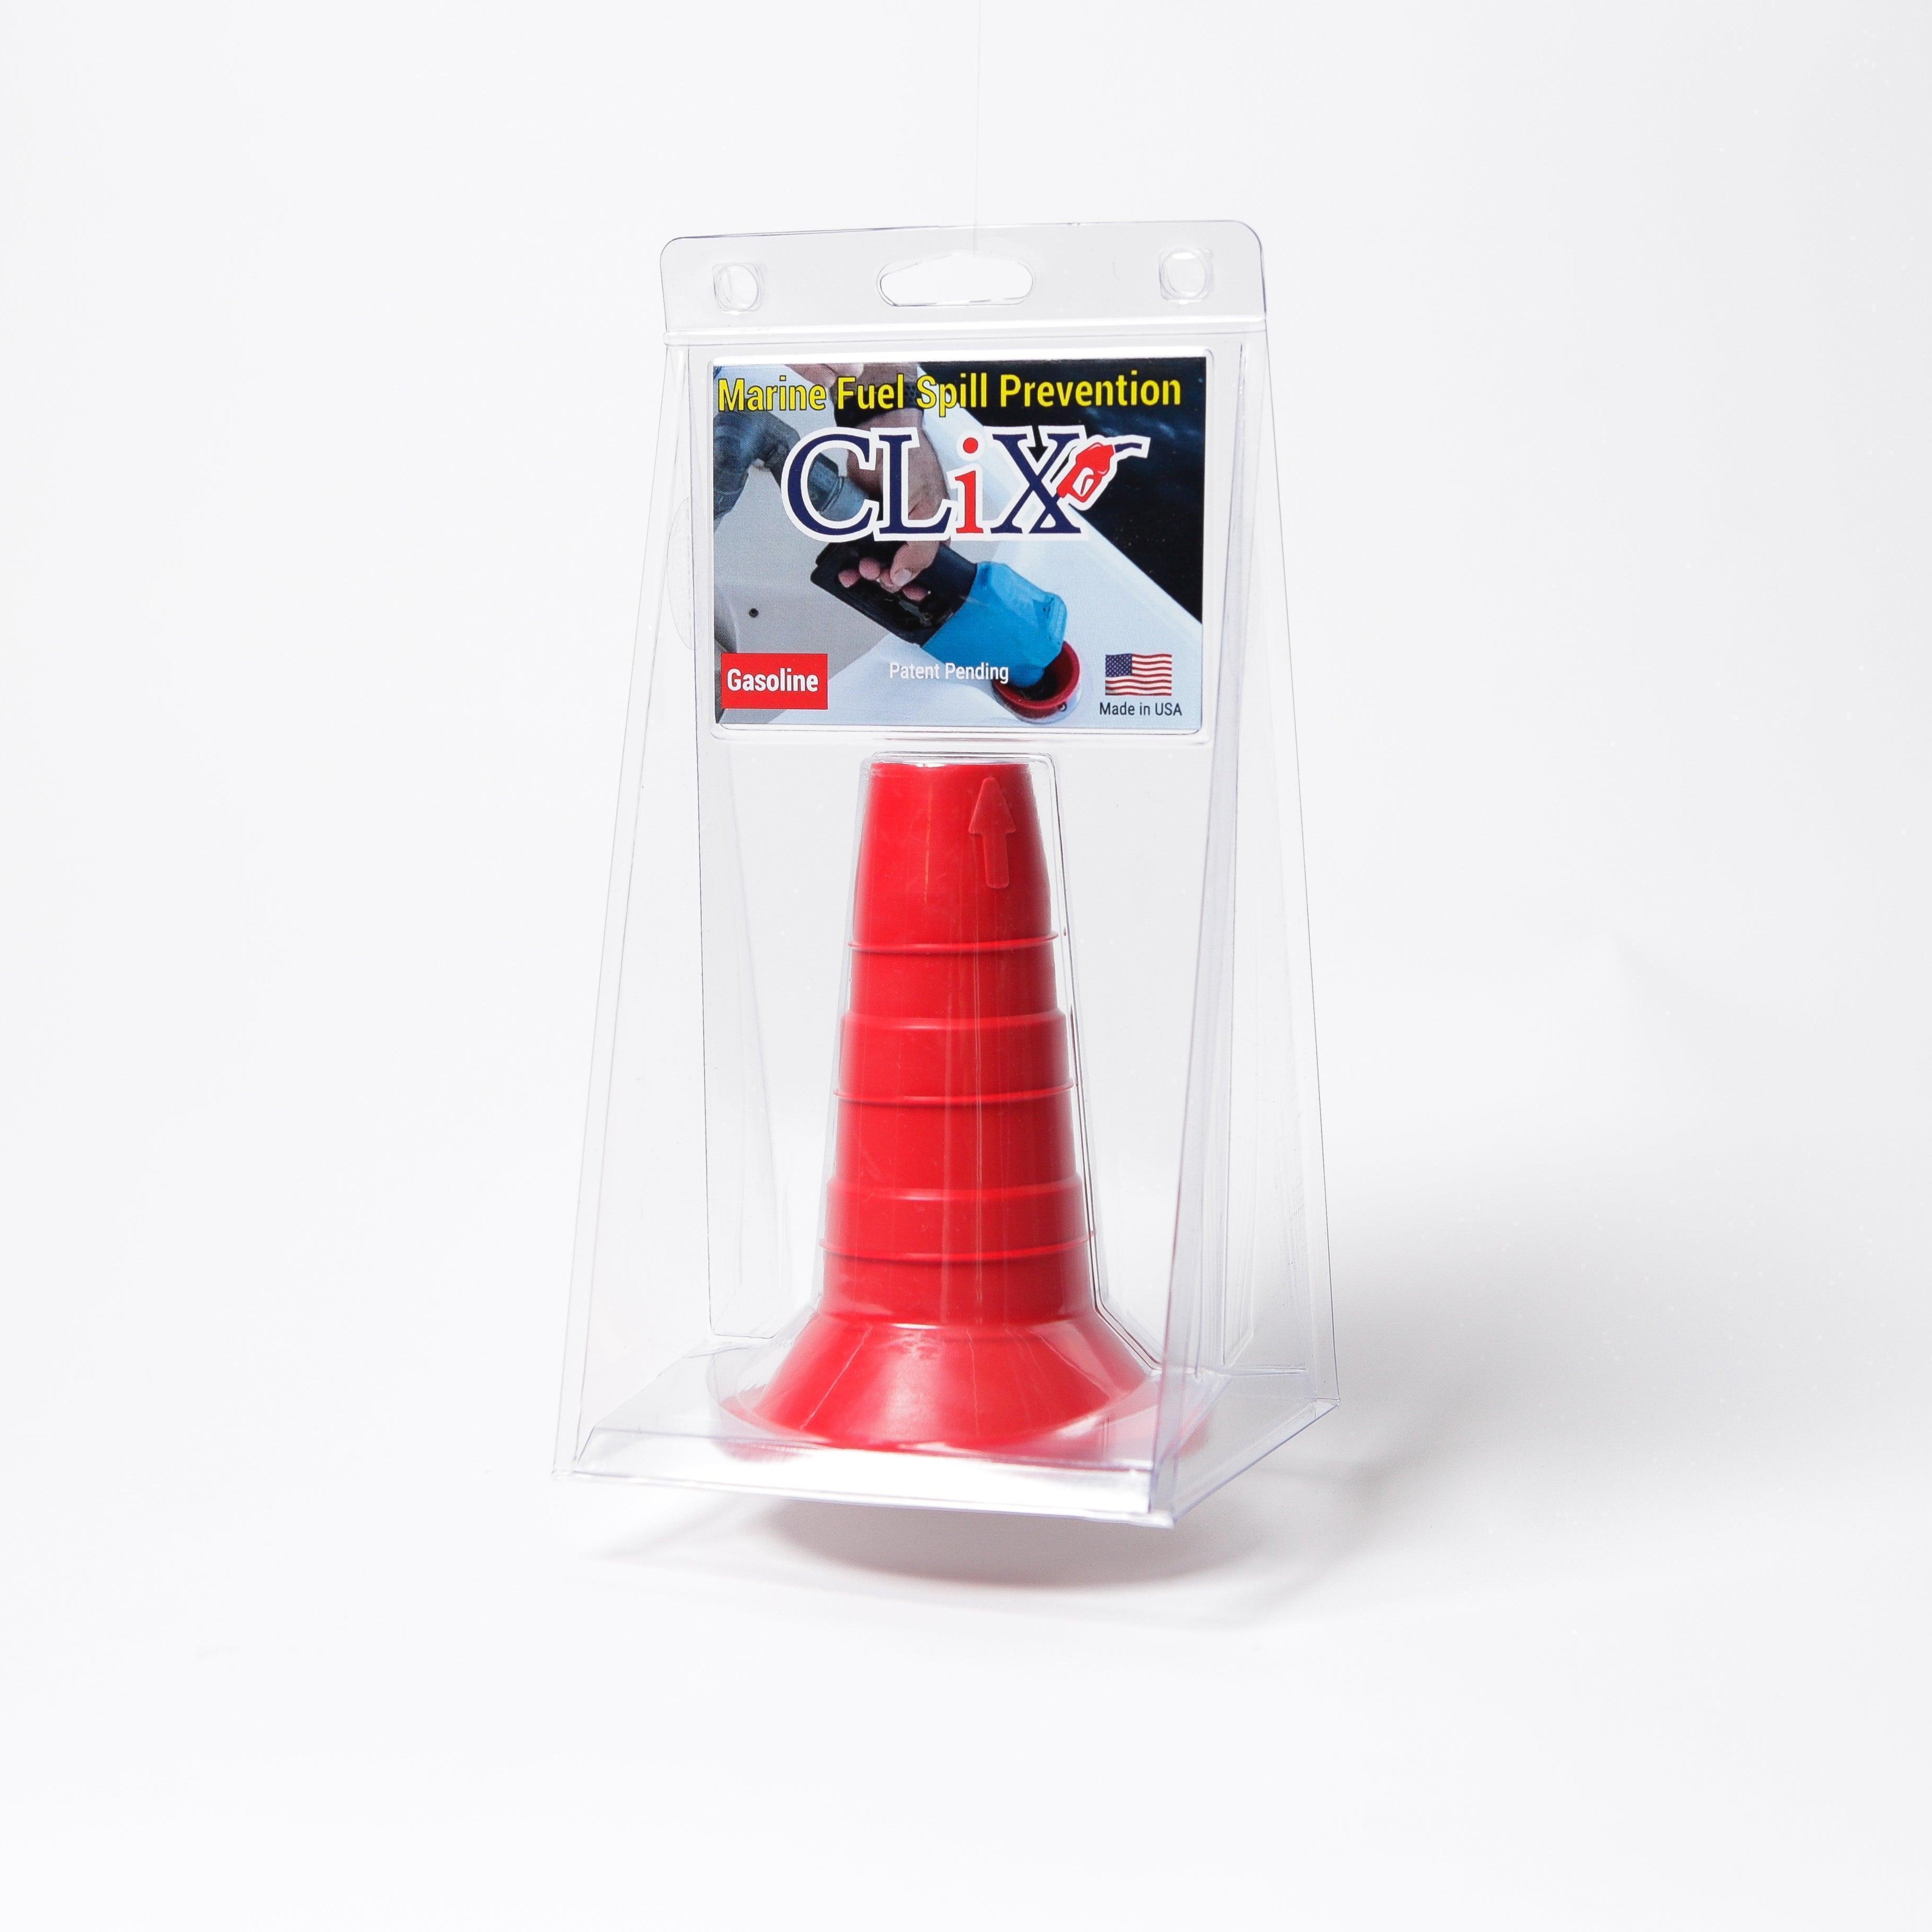
For a boat fueling station, tracking "Fuel Spillage per Transaction" can be a game-changer. A high number might point to a faulty nozzle or a process that needs rethinking. Fixing it doesn't just save money on wasted fuel; it helps you avoid environmental fines and keeps your reputation clean. In the end, OPIs give you the tactical insights to cut waste, improve your processes, and make your team more effective.
Why Tracking Operational Metrics Is Essential

Let's get practical. What do you really gain from keeping a close eye on operational performance indicators? The short answer is they let you stop putting out fires and start preventing them. They give you a massive strategic advantage.
Flying blind is no way to run a business. Without solid data, you're just reacting to problems after the damage is already done. With the right metrics, you can see trouble coming from a mile away.
Think about a swamped customer service team. The managers feel the heat, but without numbers, they're just guessing at the cause. Is the team understaffed? Are they poorly trained? Tracking a key metric like First Contact Resolution (FCR) provides a clear signal. If that FCR score is low, you know your agents aren't solving issues on the first try, which points directly to a need for better training or more accessible resources.
This is what a data-driven approach does. It helps you find the exact source of a bottleneck before it brings everything to a halt.
From Bottlenecks to Breakthroughs
Here’s another classic example: a warehouse that’s always behind on shipping. Customers are getting frustrated, and the internal team is stressed. Simply telling everyone to "work faster" is a recipe for burnout.
A smart manager, however, would start tracking the Order Fulfillment Cycle Time. This metric measures the entire journey, from the moment a customer clicks "buy" to the package landing on their doorstep.
If that cycle time is consistently high, you can dig in and find the snag. Maybe the "picking" stage—grabbing items off the shelves—is a huge time sink. That single piece of information opens the door to real solutions. You could reorganize the warehouse layout, bring in better picking tech, or shift staffing to cover peak order times.
That's the real power of operational metrics. They don't just flag problems; they light up the path to fixing them.
By tracking the right operational performance indicators, businesses can shift from a "firefighting" mentality to a culture of continuous improvement, where small, data-informed adjustments lead to major gains in efficiency and quality.
The Impact on Quality and Costs
This proactive mindset has a direct and immediate effect on the quality of your products and services, not to mention your expenses.
In marine operations, for example, fuel consumption is everything. You can optimize operations with marine fuel management systems by closely tracking your fuel usage numbers, which leads to less waste and dramatic cost reductions. When you have a crystal-clear picture of how and where every resource is being used, you can make smarter, more precise decisions.
Ultimately, keeping tabs on these daily metrics leads to a healthier bottom line. Time and again, studies show that companies that use data to make decisions are more productive and profitable than their competition. They aren't just working harder—they're working smarter, using operational performance indicators to guide every move they make.
The Main Categories of Operational Indicators
If you want to get any real value out of operational performance indicators, you have to get organized. Otherwise, you'll just be swimming in a sea of data, tracking all sorts of metrics that have little to do with what you’re actually trying to achieve. It’s like having a messy toolbox—if you don't group your wrenches, screwdrivers, and hammers, you'll waste precious time rummaging around for the right tool.
The same idea applies here. When you sort your indicators into clear categories, you can zero in on what truly matters for different parts of your operation. This ensures every metric you track is actually moving the needle.
This image shows how different operational metrics all play a part in the overall health of a production line. It's a concept that holds true for any business process, whether you're building boats or serving customers.
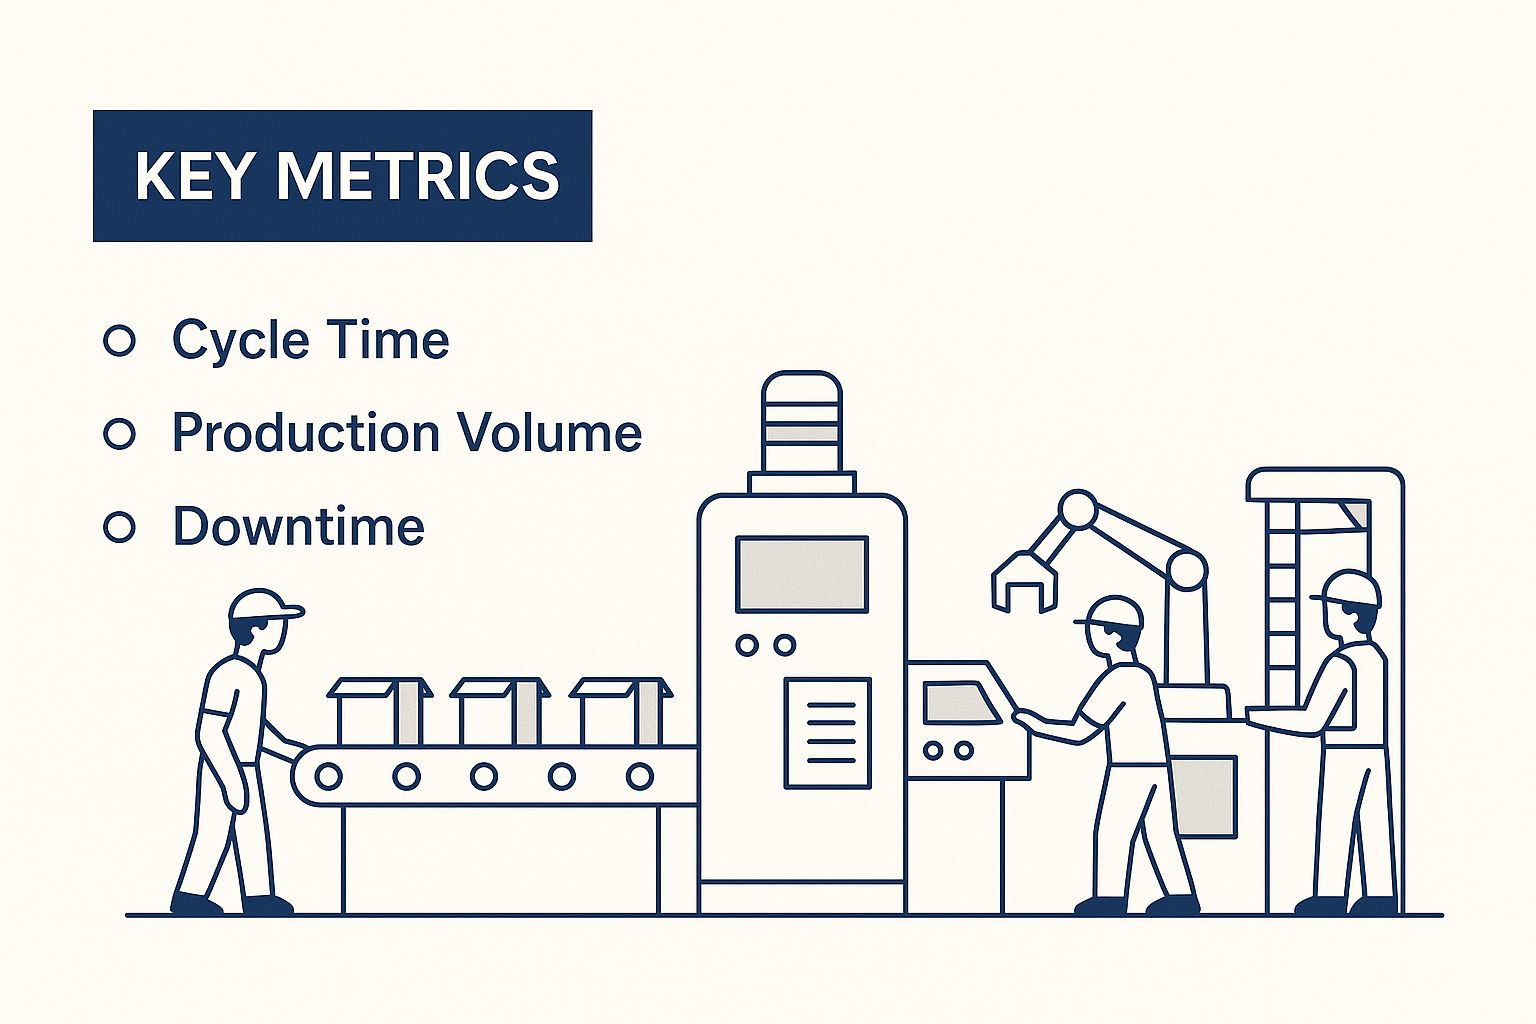
As you can see, you need a mix of financial, efficiency, and quality metrics to get the full picture. Let's dig into the four main categories you should be thinking about.
To help make this clearer, the table below outlines the major types of OPIs and gives a few concrete examples for each. Think of it as a starting point for deciding which metrics will give you the most insight into your own operations.
Common Operational Performance Indicator Categories
| Category | What It Measures | Example Indicators |
|---|---|---|
| Financial Health | The direct link between daily operations and your bottom line—profitability and sustainability. | Gross Profit Margin, Operating Cost Ratio, Return on Sales (ROS) |
| Customer Success | How well your operations meet customer needs and create a positive experience. | Customer Satisfaction (CSAT), Net Promoter Score (NPS), First Contact Resolution (FCR) |
| Process Efficiency | The speed, cost, and smoothness of your internal workflows and production cycles. | Average Fueling Time, Cycle Time, Throughput |
| Quality Control | How consistently your products or services meet established quality standards. | Defect Rate, First Pass Yield (FPY), Customer Complaints |
By looking at your operations through these four lenses, you get a balanced view that prevents you from optimizing one area at the expense of another. Now, let’s explore what each of these categories really means for your business.
Financial Health Indicators
This is where the rubber meets the road. Financial indicators are the most straightforward way to see if your operations are paying off. They translate your day-to-day activities directly into dollars and cents, showing whether you’re profitable and built to last.
Take Gross Profit Margin, for instance. This core metric reveals how much profit you make from producing your goods before other costs are factored in. Another key indicator is Return on Sales (ROS), which shows how efficiently you turn sales revenue into actual profit after covering your operational expenses. A business with a 15% ROS is making 15 cents of operating profit for every dollar it sells—a clear sign of solid operational management. For more on these fundamental financial KPIs, NetSuite offers a great breakdown you can find by checking out their guide on core financial metrics.
Customer Success Indicators
Let's face it, happy customers are what keep the lights on. This category is all about measuring how your operations are impacting the customer experience. Are they happy with what they're getting? When they have a problem, is it solved quickly and without hassle?
- Customer Satisfaction Score (CSAT): This is a direct pulse check. You simply ask customers to rate their satisfaction with a product, service, or a specific interaction.
- Net Promoter Score (NPS): This classic metric gauges loyalty by asking one simple question: "How likely are you to recommend us to a friend or colleague?"
- First Contact Resolution (FCR): A powerful indicator of efficiency, this tracks how many customer issues you solve on the very first try.
Keeping an eye on these numbers ensures your operational tweaks aren't just saving money internally—they're genuinely creating a better experience that builds loyalty and keeps people coming back. That focus on the end-user is absolutely critical for long-term growth.
Process Efficiency Indicators
These metrics get into the nitty-gritty of how smoothly things run behind the scenes. They measure the speed and cost-effectiveness of your internal processes. The goal here is simple: do more with less by cutting down on wasted time, materials, and effort.
In the world of boat fueling, a great example would be Average Fueling Time Per Boat. For a manufacturer, it might be Cycle Time—the total time it takes to create a single product from start to finish. Streamlined, efficient processes are the backbone of a profitable and scalable business. To learn more about optimizing marine operations, take a look at our guide covering the modern boat fuel system and its components.
Quality Control Indicators
Finally, we have quality control. These indicators measure how well your final product or service holds up to the standards you've set. Poor quality is a fast track to unhappy customers, costly returns, and a damaged reputation.
Here are a few common metrics used to track quality:
- Defect Rate: The percentage of your products that don't meet quality specifications and have to be scrapped or fixed.
- First Pass Yield (FPY): This measures the percentage of products made correctly the very first time, without needing any rework. A high FPY is a sign of a very healthy process.
- Customer Complaints: A raw, direct signal of how often your products or services are failing to live up to what your customers expect.
How to Choose the Right OPIs for Your Business
Picking the right operational performance indicators isn't about fancy software; it’s about clear thinking. The single biggest mistake I see companies make is falling into the "track everything" trap. They end up drowning their teams in a sea of data that doesn't actually mean anything. The real key is to sidestep these vanity metrics and zero in on what truly moves the needle for your business.
Start by working backward from your main business goals. Don't just grab metrics from a generic list. Instead, ask yourself: what are we really trying to accomplish here? Are we looking to slash costs? Make customers happier? Speed up our delivery times? Your goals are your compass, and they'll point you directly to the OPIs that matter.
For example, a local retail shop trying to improve customer happiness might track "Average Checkout Time." But a global software company with the exact same goal would probably focus on something like "First Contact Resolution" for their support tickets. The objective is the same, but the right OPI is completely different because their business models are different.
A Simple Framework for Selection
You don't need a complicated system to choose effective OPIs. Following a straightforward process ensures every metric you track gives you real, valuable insight. This approach helps you draw a straight line from your team's daily work to your company's biggest goals, making your data both relevant and powerful.
-
Map Your Core Processes: First, just sketch out the essential workflows in your business. This could be anything from fulfilling an order and onboarding a new customer to manufacturing a product or delivering a service.
-
Identify Impactful Activities: Within each of those processes, pinpoint the specific actions that have the biggest impact on your costs and customer experience. These are the moments that matter most.
-
Ensure Metrics are Actionable: Finally, for each of those critical activities, pick a metric that's simple to measure and that your team can actually influence. If your team can't do anything to change the number, it's not a useful OPI.
Connecting Operations to Financial Health
At the end of the day, your OPIs should tell a story about how efficiently your business turns its resources into value. A powerful metric that connects daily operations with financial results is the Percentage of Return on Assets (ROA). It simply measures how well you're using what you own (your assets) to generate profit.
For instance, a factory full of heavy machinery will have a very different ROA benchmark than a consulting firm that relies on its people's expertise. As experts from The KPI Institute explain, tying your operational efficiency directly to your strategic growth goals is essential for long-term success, which is why benchmarking against others in your industry is so important.
The Litmus Test for a Good OPI: Can a frontline manager look at this number and know instantly whether their team had a good day or a bad day? If the answer is yes, you've likely found a winner.
Operational Indicators Look Different Everywhere You Look
While the big idea behind operational performance indicators is the same everywhere, how they look in practice changes dramatically from one industry to the next. The numbers a software company obsesses over are completely different from what a busy healthcare clinic or a real estate agency would track.
Seeing how they're used in different fields really drives home one crucial point: the best OPIs are never one-size-fits-all. Sure, the fundamentals of measuring efficiency, quality, and customer happiness are universal, but the specific metrics have to fit your unique business. Let's look at a few examples.
How Different Sectors Track Success
-
E-Commerce Business: An online shop's success hinges on getting products out the door fast and keeping shoppers happy. They'll watch metrics like Order Fulfillment Cycle Time—the total time from a customer's click to the package landing on their doorstep—and Cart Abandonment Rate, which shows how many people bail before making a purchase.
-
Healthcare Clinic: In a medical setting, efficiency is directly tied to patient care. A clinic will keep a close eye on Patient Wait Times to keep things running smoothly and Bed Occupancy Rate to make sure they have the capacity and staff to handle demand.
-
Transportation and Logistics: For any company managing a fleet of vehicles, operations are all about asset use and safety. It's why understanding essential fleet management systems is so important. They help track crucial OPIs like On-Time Delivery Rate and Fuel Efficiency (miles per gallon), which have a massive impact on the bottom line.
When you look at these different applications, it becomes obvious that choosing the right OPIs isn't about grabbing a generic list off the internet. It's about looking at your own day-to-day work and asking, "What activities have the biggest impact on our profits and our customers' happiness?" Your most powerful metrics will come from the answer to that question.
A Closer Look at Real Estate
Real estate is a fantastic case study because its operational metrics directly link behind-the-scenes work to tangible results. The ultimate goal is simple—sell properties—but the journey to get there is anything but.
Agencies rely on key OPIs like Time on Market to see how quickly properties are moving and Average Transaction Time to measure how fast deals are closing. These numbers offer a clear window into their process efficiency.
Then you have sales-focused metrics like Lead Conversion Rate and Sales Per Agent, which tie an agent's daily grind directly to revenue. And to make sure speed doesn't ruin the customer experience, they track things like the Client Satisfaction Score. It’s the perfect blend of measuring internal productivity and external success, a concept you can dive deeper into by learning how operational KPIs work in real estate.
Turning Operational Data Into Action

Choosing the right metrics is just the starting line. The real magic happens when you use those operational performance indicators to make meaningful changes. After all, raw data sitting on a server doesn't do anyone any good. The whole point is to turn those numbers into better, smarter actions on the dock.
This begins with creating a culture where data is a guide, not a judge. When you use data to spotlight opportunities for improvement instead of pointing fingers, your team gets on board. They start to see exactly how their day-to-day work connects to the bigger picture, and they become partners in driving the business forward.
Creating Clarity with Dashboards
To get your data out of spreadsheets and into your team’s hands, you need simple, visual dashboards. A great dashboard tells a clear story at a glance, instantly showing what's going well and where the friction points are. Resist the urge to cram it full of every metric you can think of. Instead, focus only on the vital OPIs that truly move the needle.
For a boat fueling operation, a useful dashboard might highlight just a few key things:
- Average Fueling Time: Are we getting vessels back on the water quickly?
- Spillage Incidents: How are we doing on safety and environmental care?
- Customer Satisfaction Score: Do our clients feel well-served?
This kind of clarity ensures everyone, from the crew on the fuel dock to the manager in the office, is on the same page.
The most effective operational dashboards are designed for the people who will use them every day. If a team can’t understand the data within 30 seconds, the dashboard has failed.
From Data to Decisions
Once you have clear dashboards, you need a rhythm for reviewing them. Regular meetings—maybe weekly or every two weeks—to talk through the OPIs build accountability and keep the momentum going. These shouldn't be dry report-outs. Think of them as collaborative problem-solving sessions where your team can dig into the "why" behind the numbers and brainstorm solutions together.
When your team sees that data leads directly to smarter decisions and positive changes, they develop a real sense of ownership. Ultimately, this entire process is about implementing changes that genuinely improve how you operate. You can find some excellent strategies to improve operational efficiency that will help you put your insights into practice.
This proactive approach is the key to long-term success. To see how these ideas play out in the real world, check out our guide on https://clixfueling.com/blogs/news/marine-fuel-management-expert-strategies-that-cut-costs.
Got Questions About OPIs? We've Got Answers.
We've covered a lot of ground on operational performance indicators. It's only natural if you still have a few questions bubbling up. This final section tackles some of the most common ones we hear, giving you clear, straightforward answers to help you put OPIs to work in your real-world operations.
What’s the Real Difference Between an OPI and a Strategic KPI?
It's a great question, and the answer comes down to perspective: are you looking at today's tasks or tomorrow's goals?
Think of it like this: an OPI is all about the "how" of your daily work, while a strategic KPI is about the "why" behind your long-term vision.
- An OPI is boots-on-the-ground. It measures a specific, everyday process. A perfect example is "average time to fuel a boat." It tells you how efficiently your crew is working right now.
- A strategic KPI is the big picture. It tracks progress toward a major business goal, like "achieving 15% market share growth this year."
So, while OPIs help you do things right day-to-day, KPIs make sure you're doing the right things to win in the long run.
How Can a Small Business Track OPIs Without Breaking the Bank?
You absolutely don't need a fancy, expensive software suite to get started. The secret is to start small and focus on what truly matters. First, pinpoint just three to five OPIs that have the biggest, most immediate impact on your costs or your customers' happiness.
From there, a simple spreadsheet in Google Sheets or Microsoft Excel is all you need. The most important thing isn't the tool, but the routine. Commit to updating your numbers weekly and, most importantly, set aside time to actually talk about what those numbers are telling you with your team. This simple, no-cost approach builds a data-focused habit that you can easily scale up later.
It’s not the software that creates change; it's the consistent habit of looking at your performance and acting on what you learn. Start small, be consistent, and the results will speak for themselves.
How Often Should We Be Looking at Our OPIs?
There’s no one-size-fits-all answer here—it really depends on the metric. For fast-moving indicators like "gallons pumped per shift" or "number of boats fueled per day," you'll want to glance at them daily or at least weekly.
For metrics that track slightly longer cycles, like "average downtime for a fuel pump" or "supply chain delivery times," a weekly or bi-weekly review usually works best. Broader indicators like "customer satisfaction scores" can be looked at monthly. The goal is to find a rhythm that lets you spot a negative trend and fix it before it snowballs into a real problem.
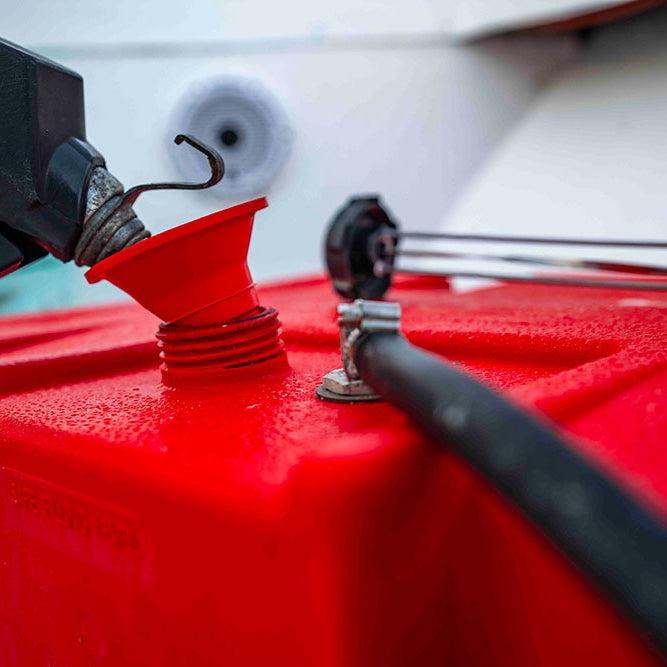
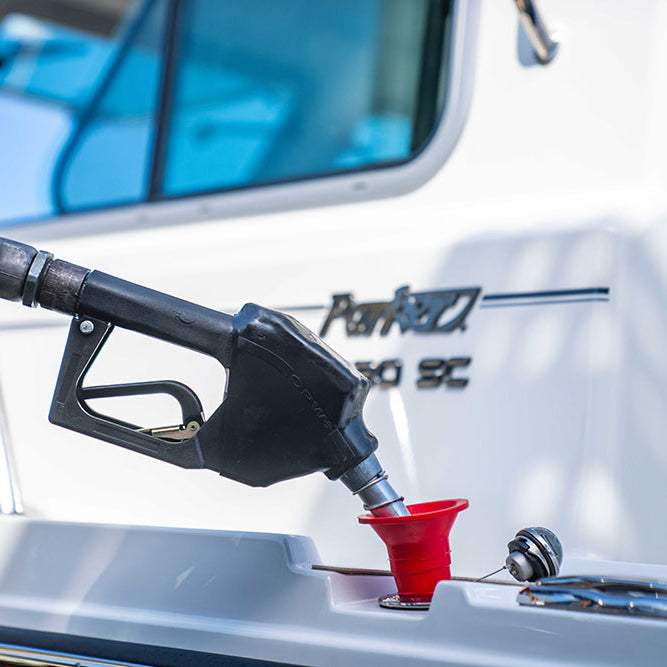
Ready to eliminate spills and make every fueling stop safer and more efficient? Discover how CLiX Fueling Solutions can bring precision and peace of mind to your operations. Explore our spill-free fueling systems today!